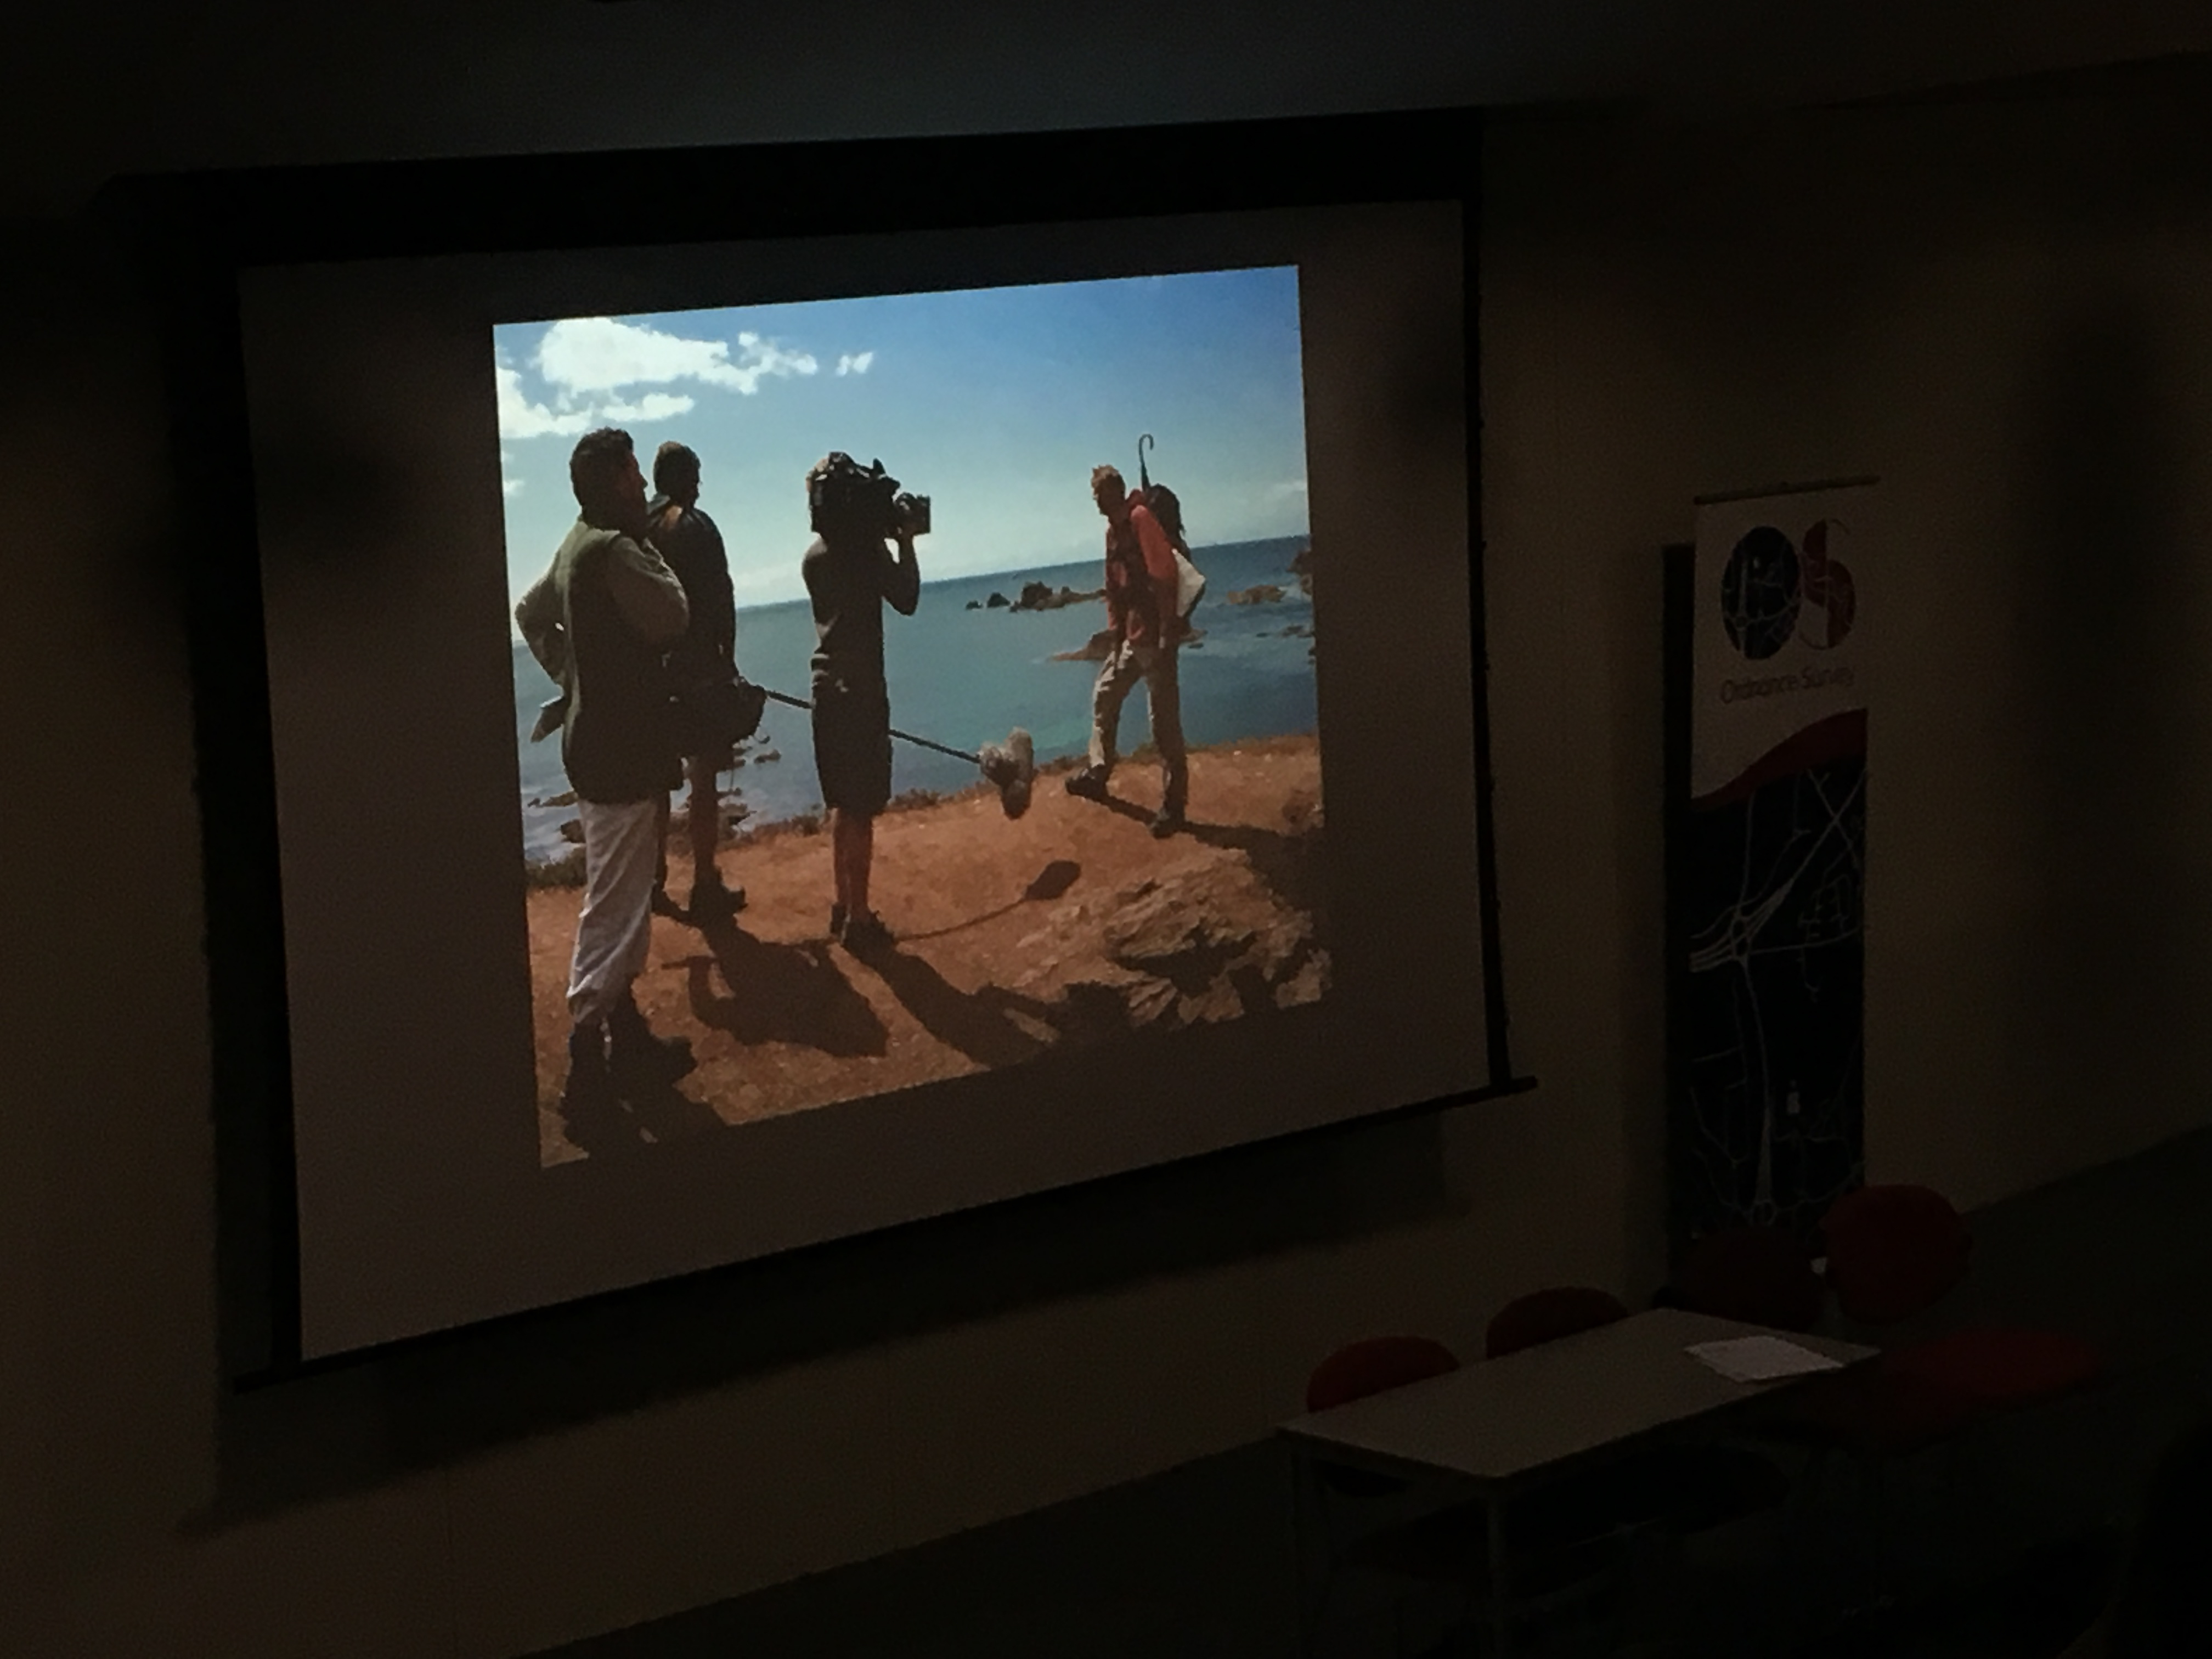
This was my first time at one of the UK’s most important GIS conferences, GISRUK, and I was very impressed by the high level of the contributions. For landscape science, the ecology session was particularly interesting, e.g. Gullick et. al.’s (2017) presentation about tree risk evaluation. Other relevant sessions on remote sensing, VGI and visualisation. Between sessions, Prof. Andy Hudson-Smith from the Bartlett Centre for Advanced Spatial Analysis CASA and at the end of the conference, BBC2 presenter Nick Crane gave intriguing key notes.
Some of Nick Crane’s work can be explored as @ESRI #Storymap “The Making of the British Landscape” http://esriuk.com/nicholascrane
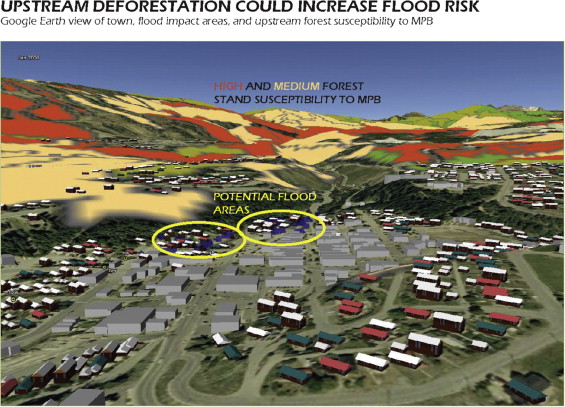
I am excited to present the following research paper in Landscape and Urban Planning because it summarizes the work my colleagues and I put into my favorite research project, the Kimberley Climate Adaptation Project KCAP. It was very rewarding working closely with the local community, visualizing different development scenarios and their interactions with climate change impacts. Great to see that about 70 recommendations from the original visioning process were adopted in various policy documents and a dozen actually implemented. The paper looks in more detail at one of the implemented mitigation measures, a flood retention area along the river that leads through Kimberley.
Reference:
Olaf Schroth, Ellen Pond, Stephen R.J. Sheppard, Evaluating presentation formats of local climate change in community planning with regard to process and outcomes, Landscape and Urban Planning, Available online 1 May 2015, ISSN 0169-2046, http://dx.doi.org/10.1016/j.landurbplan.2015.03.011.
Abstract:
This study synthesizes two evaluations of a local climate change planning process in a rural town in British Columbia (Canada), which was supported through landscape visualizations. First, the impact of the visualizations, based on scientific environmental modeling and presented in three different presentation formats, verbal/visual presentation, posters and a virtual globe, was evaluated with regard to immediate impacts during the process. Second, the long-term impacts on decision-making and actual outcomes were evaluated in a retrospective evaluation 22 months after the end of the initial planning process. Two results are highlighted: according to the quantitative pre-/post-questionnaires, the visualizations contributed to increased awareness and understanding. Most importantly, the retrospective evaluation indicated that the process informed policy, operational and built changes in Kimberley, in which the landscape visualizations played a role. The post interviews with key decision-makers showed that they remembered most of the visualizations and some decision-makers were further using them, particularly the posters. The virtual globe seemed to be not a “sustainable” display format suitable for formal decision-making processes such as council meetings though. That may change with the further mainstreaming of visualization technologies or mobile devices. Until then, we recommend using display formats that can be re-used following a specific planning event such as an Open House, to ensure on-going support for effective decision-making over the longer-term.
Research Highlights:
• Visualizations in a climate change planning process were assessed as very helpful by local stakeholders and residents.
• Visualizations presented in a virtual globe facilitated understanding and increased awareness during an open house.
• 22 months later most decision-makers still remembered or used the visualizations.
• Visualizations embedded into process informed policy, operational and built changes.
• Although the virtual globe presentation format was effective during the process it was less so in the long term.
To begin with, I should say that I had less time to spend on the LVIZ blog since I moved on to a new position as lecturer in landscape planning and GIS at the University of Sheffield. Said that, my move to the UK also comes with meeting new researchers who do exiting work around GIS and landscape. One of these researchers is Alasdair Rae and his blog “under the raedar”. The focus is on geospatial data and all the amazing things you can do with it: http://undertheraedar.blogspot.co.uk/
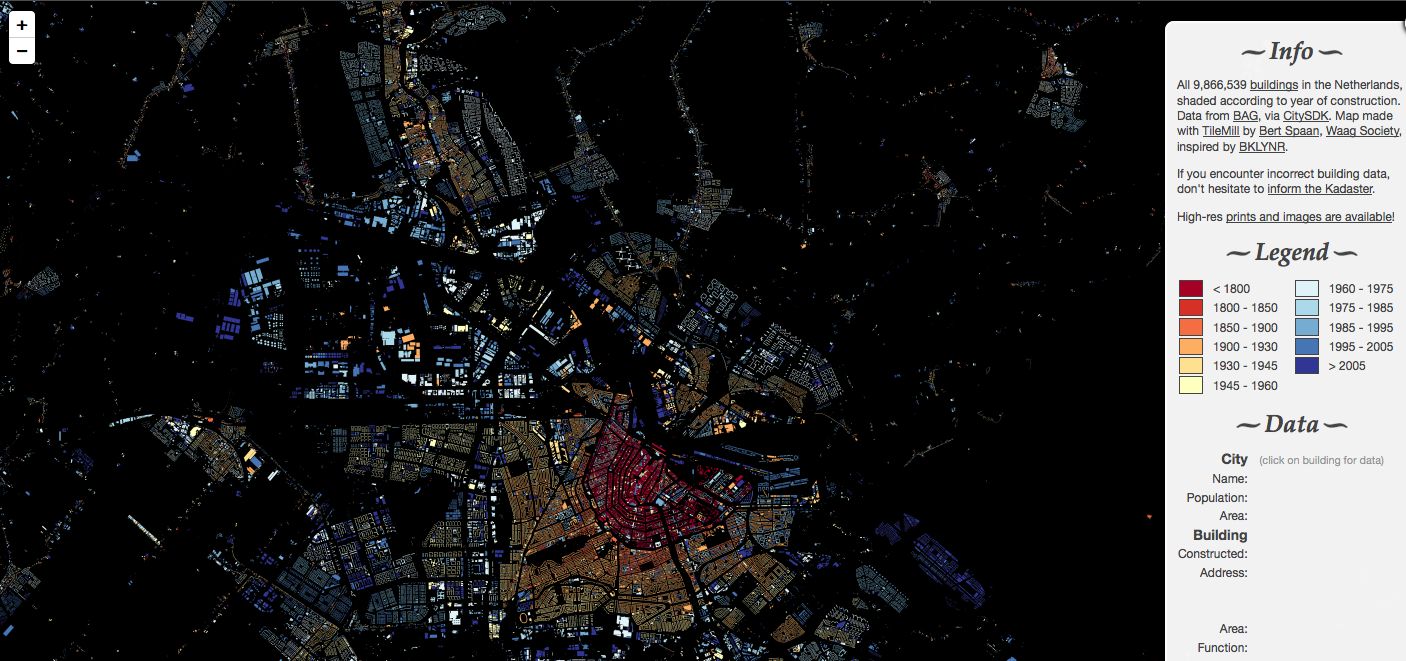
In this context, I would also like to draw your attention to an amazing Dutch website that he pointed out in his lecture. http://dev.citysdk.waag.org/buildings/ is an interactive map of ALL 9.8 Mio. buildings in the Netherlands, color coded by year of construction.
An exclusive look inside Ground Truth, the secretive program to build the world's best accurate maps by Alexis C. Madrigal, enior editor at The Atlantic.