PECSRL 2016 Permanent European Conference on the Study of the Rural Landscape

Last week, the Permanent European Conference on the Study of the Rural Landscape PECSRL conference 2016 took place in Innsbruck and Seefeld (Austria). It was my first time at PECSRL and I was impressed how well organised it was. It was also a very productive time because it had merged with the autumn meeting of a COST Action network I´m in. And last not least, I liked the basic PECSRL idea to host the first two days in an urban environment, then go on a field trip, and host the last two days out in the countryside.

The presentations stood out through their great variety but most topics were not directly related to the theme of this blog. Except the presentation by Salak, Boris & Brandenburg, Christiane: Mixed method design as a supportive tool for evaluation of interactive 3D approaches to enhance objectification in wind energy planning processes in Session 5: Renewable energies in mountain landscapes: conflicts and synergies.

As part of the Windnet project, the authors and their colleagues organised expert workshops, survey and interviews with 27 wind energy relevant organisations. One part of the project addressed the use of visualizations in the workshops and the research question was: Is there a difference between the following three different visualisation techniques?

  • Slideshow (low immersion)
  • Interactive 3D model in game engine using a PS3 controller
  • Virtual Reality w/ stereo images, running on a mobile phone
Salak 2016
Salak 2016


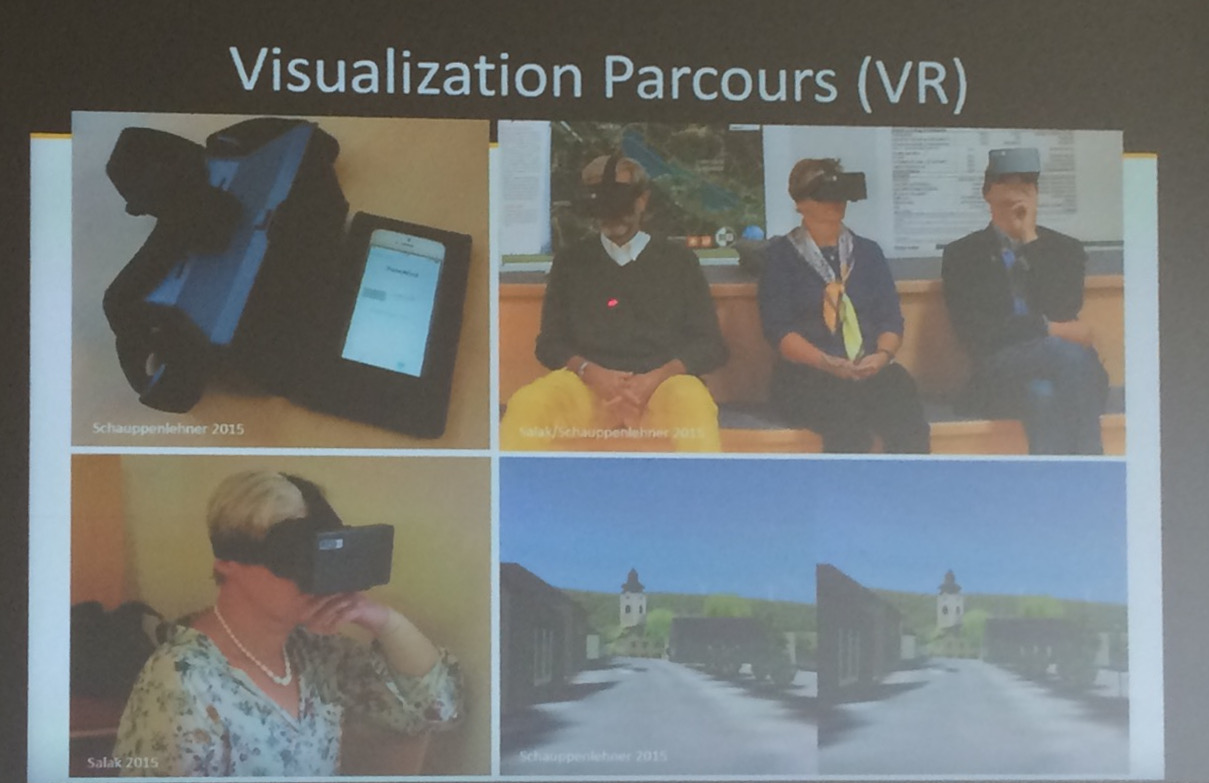
70 participants completed the visualization parcour and in summary gave the following feedback:

  • Very positive feedback regarding the visualizations across all groups
  • participants trust in the information 3D
  • participants navigate very oriented in digital spaces
  • participants visit emotional landscapes first in 3d
  • participants check plausibility
  • mention transparency
  • technical tools supports personal imagination
  • good technical equipment

The full report can be read at http://www.ssoar.info/ssoar/handle/document/47895 and further information is provided at www.transwind.boku.ac.at

Fully funded PhD on landscape visualization at the University of Rhode Island

(c) Peter Stempel (2016)

In his dissertation, Peter Stempel at the University of Rhode Island has done outstanding research about the ways in which realism used in visualizations influences the perception of risk (see the figure above for an example). His particular focus has been on storm surges and sea level rise, continuing some of the work done by Prof. Stephen Sheppard, David Flanders, me and others at the Collaborative for Advanced Landscape Planning at UBC and published in Sheppard (2012) “Visualizing Climate Change”.

(c) Peter Stempel 2016

Peter has also made a short presentation at a recent estuarine and coastal modelling conference last week and you can watch a narrated version here: https://vimeo.com/171324965

Now, the University has created a position for someone to participate in and continue the work Peter has begun. This position is a fully funded assistantship focused on visualization (PhD).  Rhode Island University are actively recruiting applicants.

Contact regarding the PhD position should go to Dr. Austin Becker abecker@uri.edu, and Dr. Peter Stempel peter_stempel@uri.edu.

PhD candidate job description


Save

Save

Save

New research paper on sound in landscape visualisation

Ass. Prof. Dr. Mark Lindquist, who completed his PhD at the Department of Landscape at the University of Sheffield, just published a paper in Landscape and Urban Planning summarizing his findings about the contribution of sound to the perception of landscape visualisations.

His key research findings are:

  • Sound significantly alters perceptual responses to 3D landscape visualizations.
  • Realism and preference are moderated by congruency of visual and sound content
  • Eye level Google Earth visualizations receive low realism ratings.
  • Aural-visual survey data collected via the web is comparable to laboratory data.
  • Sound and visuals that are spatiotemporally congruent are recommended for simulations.

You can read and download the fully accessible open source paper by Lindquist, Lange and Kang (2016) here: From 3D landscape visualization to environmental simulation: The contribution of sound to the perception of virtual environments

Views and landscape elements used in the research: view 1 (top row); view 2 (middle row); view 3 (bottom row); by visual condition (1 left column; 2 middle column; 3 right column) (©Google Earth).


VR First initiative by Crytek aims to create VR labs at universities around the globe

Crytek, a company famous for its first person computer games with vast landscape areas in cutting edge visual quality, has launched the VR First Initiative. Objective of the initiative is to support universities around the globe in launching Virtual Reality (VR) labs, where the next generation of computer programmers and designers can practice.

I’ve been involved in a couple of visualisation labs at European and Canadian universities and it was always the biggest challenge to manage and update the hardware over time. When the first Oculus Rift came out, I already wondered whether we could replace resource intense facilities such as visualisation domes (360º projection domes) with rather affordable and easy to update VR glasses. It looks as if Crytek is implementing this approach on an interconnected global scale now and with their knowledge in visualisation, this will be a most interesting initiative to watch.


Evaluating presentation formats of local climate change in community planning with regard to process and outcomes

I am excited to present the following research paper in Landscape and Urban Planning because it summarizes the work my colleagues and I put into my favorite research project, the Kimberley Climate Adaptation Project KCAP. It was very rewarding working closely with the local community, visualizing different development scenarios and their interactions with climate change impacts. Great to see that about 70 recommendations from the original visioning process were adopted in various policy documents and a dozen actually implemented. The paper looks in more detail at one of the implemented mitigation measures, a flood retention area along the river that leads through Kimberley.

The paper is open access and can be downloaded for free at http://www.sciencedirect.com/science/article/pii/S0169204615000651

This figure shows the Kimberley town center with an overlay of potential flood areas as identified in the municipal flood risk study (highlighted through circles) and the areas for future mountain pine beetle susceptibility, derived from the susceptibility model (orange/dark shading in black/white for high susceptibility and yellow/light shading in black/white for medium). It led to the conclusion that increased mountain pine beetle damage will increase the amount of dead wood and therefore increase flood risk from debris jams at the highlighted bottlenecks (geodata© 2009 Google)

Reference:
Olaf Schroth, Ellen Pond, Stephen R.J. Sheppard, Evaluating presentation formats of local climate change in community planning with regard to process and outcomes, Landscape and Urban Planning, Available online 1 May 2015, ISSN 0169-2046, http://dx.doi.org/10.1016/j.landurbplan.2015.03.011.

Abstract:
This study synthesizes two evaluations of a local climate change planning process in a rural town in British Columbia (Canada), which was supported through landscape visualizations. First, the impact of the visualizations, based on scientific environmental modeling and presented in three different presentation formats, verbal/visual presentation, posters and a virtual globe, was evaluated with regard to immediate impacts during the process. Second, the long-term impacts on decision-making and actual outcomes were evaluated in a retrospective evaluation 22 months after the end of the initial planning process. Two results are highlighted: according to the quantitative pre-/post-questionnaires, the visualizations contributed to increased awareness and understanding. Most importantly, the retrospective evaluation indicated that the process informed policy, operational and built changes in Kimberley, in which the landscape visualizations played a role. The post interviews with key decision-makers showed that they remembered most of the visualizations and some decision-makers were further using them, particularly the posters. The virtual globe seemed to be not a “sustainable” display format suitable for formal decision-making processes such as council meetings though. That may change with the further mainstreaming of visualization technologies or mobile devices. Until then, we recommend using display formats that can be re-used following a specific planning event such as an Open House, to ensure on-going support for effective decision-making over the longer-term.

Research Highlights:
• Visualizations in a climate change planning process were assessed as very helpful by local stakeholders and residents.
• Visualizations presented in a virtual globe facilitated understanding and increased awareness during an open house.
• 22 months later most decision-makers still remembered or used the visualizations.
• Visualizations embedded into process informed policy, operational and built changes.
• Although the virtual globe presentation format was effective during the process it was less so in the long term.

Keywords:
Climate change; Participatory decision-making; Landscape visualization; Virtual globe; Process evaluation; Policy outcomes

“See the Change” – Article in Landscape Architecture Magazine December 2013 about Climate Change Visioning

On pages 64ff. of its December issue, the Landscape Architecture Magazine LAM is reporting about the Climate Change Visioning work at the Collaborative for Advanced Landscape Planning:

Ecoinformatics Touchtable by VeRSI

Very informative video by the Victorian eResearch Strategic Initiative (VeRSI) on their combination of ArcGIS with their scenario plugin and the 3D game engine SIEVE for visualization; all linked to a touchtable user interface.

Ecoinformatics Touchtable from VeRSI on Vimeo.

Siggraph 2011 – Day 3

One of todays` highlights at SIGGRAPH 2011 in Vancouver was the approach of Prof. Deussen`s group in Konstanz and their partners at the universities in Shenzhen and Tel Aviv to use so-called “texture-lobes” for tree modelling from Lidar data. For more information, see http://graphics.uni-konstanz.de/publikationen/2011/texturelobesfortreemodeling/website/

Texture-Lobes for Tree Modelling from Soeren Pirk on Vimeo.

The afternoon was dedicated to urban modeling, starting with a review of the latest literature by Peter Wonka (Arizona State University) and Daniel Aliaga (Purdue University). During the second part of the session, Pascal Mueller from Procedural/ESRI (CityEngine) presented issues encountered in practice and their new Urban Vision project together with the urban planning department of San Francisco and Urban Sim (Paul Waddell). The session closed with a visually very engaging case study by Michael Frederickson from Pixar, using CityEngine for virtual London in Cars 2.

Redwood Watch

The following YouTube video shows Redwood forests in California and asks questions on how climate change may impact their future habitats. The Save the Redwoods League calls viewers for participating in mapping Redwood stands and thereby, contributing to the research about climate change impact on this species.

Mangroves of Mexico as Google Earth Outreach example for GE6 in cooperation with CONABIO

Three weeks ago, Google had launched its new version 6 of Google Earth parallel to the Cancun conference, where Google Earth Outreach participated as well. Now, Google Earth Outreach together with the Mexican National Commission for Knowledge and Use of Biodiversity CONABIO launched the first outreach project taking advantage of the newly implemented tree representations (download the kmz into GE here). The trees still look a bit sketchy in comparison to other products but the visualization seems to be based on credible and sophisticated vegetation data.

Source: Google Earth Outreach