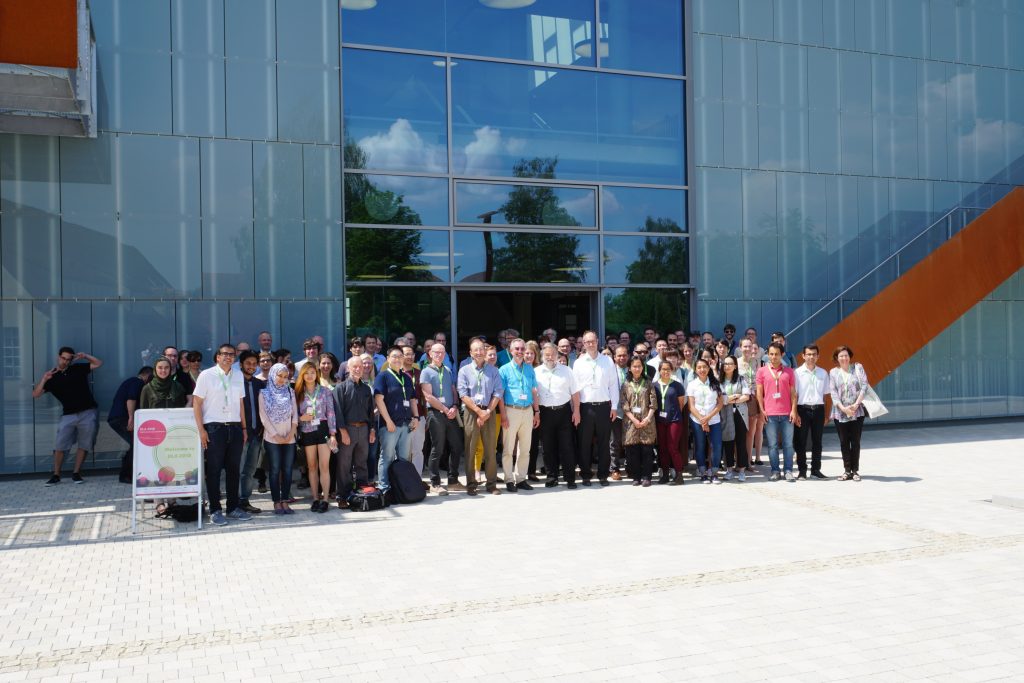
 Knowledge transfer at a very high scientific level: the Digital Landscape Architecture Conference 2018 at Weihenstephan-Triesdorf (HSWT) hosted 130 participants from 22 countries from May 30th to June 2nd discussing the latest research and applications of information technology in landscape architecture. At the same time, the conference honored 30 years of landscape informatics through Prof. Dr. Ulrich Kias.
The conference started with a geodesign workshop run by Harvard professor Carl Steinitz and his colleague Olaf Schroth at HSWT, since 2017 professor of geodesign and landscape informatics at HSWT. In the workshop, six stakeholder groups developed and negotiated different scenarios for the area between Olympic Park and city´s edge in the north of Munich. The workshop was facilitated through the open online platform geodesignhub.
 Other international scientists and practitioners, who gave key notes, were Prof. Joan Nassauer, University of Michigan, Prof. Kelleann Foster, Pennsylvania State University, Prof. Stephan Sheppard, University of British Columbia and Mike Shilton of the Landscape Institute in England. The public talk by Dr. Jörg Rekittke, addressing the “Challenges and approaches of landscape research and design in the global south”, was also highly appreciated by the audience.
In addition to key notes, the various lecture sessions addressed the themes geodesign and climate change, big data in landscape architecture, Building Information Models (BIM), drones/UAVs for data survey, social media and VR/AR. Various speakers demonstrated the latest developments and applications in practice examples such as the use of high resolution laserscanning data and digital terrain models, the use of environmental sensors and VR/AR displays.
If you are now interested, the next DLA conference will take place in Dessau in 2019 and celebrate the 20th anniversary of the conference series and in 2020, the well-established Harvard Graduate Design School will host the 21st DLA. For more information please see the conference website at dla.hswt.de.
Papers and key notes can be downloaded at: gis.point


