GoogleEarth 6 plants 3D trees

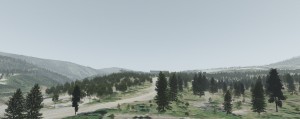
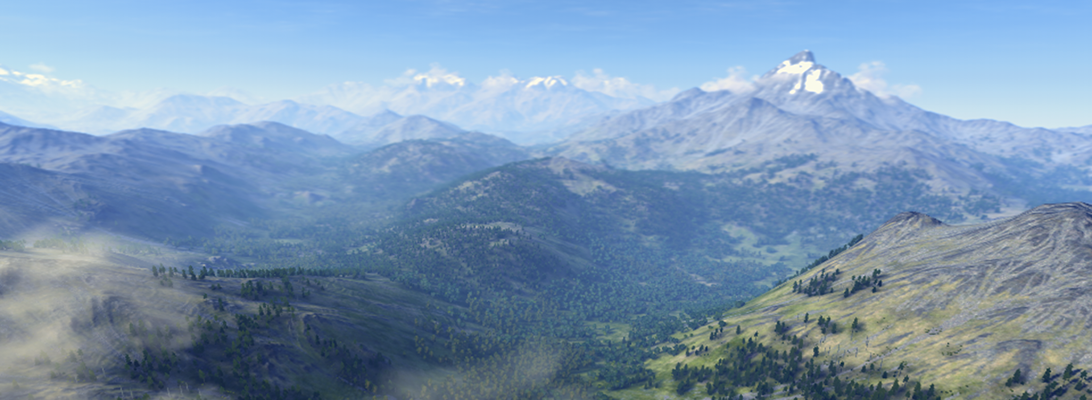
Google published version 6 of GoogleEarth and the most important update for our profession is that it comes with 3D trees!

However, not the whole Earth is populated with trees yet but only some areas in a few selected cities: According to TechCrunch 80 million trees were “planted” in Athens, Berlin, Chicago, New York City, San Francisco and Tokyo. Yet, the quality of trees is rather low but Google claims to distinguish 50 species already. Other updates of version 6 include an enhanced integration of StreetView and a more user-friendly overview and navigation through historic aerial images. The new version is a beta and does not update automatically but must be installed from the Google download site. A GoogleEarth showcase can be downloaded here.

The key question for us is how the integration may facilitate the use of GoogleEarth as a tool in landscape related design and planning professions. Sheppard and Cizek (2009) discussed the various technical and ethical issues of previous GoogleEarth versions and identified the lack of vegetation as one of the major limitations. Our tests in the Kimberley Climate Adaptation Project supported the argument that the lack of vegetation distorts the representation of future design scenarios in GoogleEarth and inhibits the otherwise potentially useful tool for landscape planning.

In this context, the new GoogleEarth version allows new user tests and applications. Next steps could be to explore how 3D trees are inserted and distributed, assessments how realistic GoogleEarth forest stands are,  and how user´s landscape perception will change with regard to Google´s “Tree View”. As one of the first new applications, Google.org is planning to use the virtual trees to push (real) reforestation campaigns.
Call for Papers – AGIT Exhibition and Conference 2011

Salzburg July 6-8, 2011

AGIT is a well established conference where every year many members of the German-speaking geoinformation community come together. Now the call for papers for 2011 will open from December 1, 2010 to February 1, 2011.

Themes in 2011 will be:

  • Nature and landscape, climate and hydrology
  • HealthGIS
  • Sustainable energies, water management and spatial planning
  • Mobility
  • geoGovernment
  • GeoMES: Catastrophe management
  • Geoinformation in infrastructure management

Methods and Technologies

  • 3-D models and cartographic communication
  • Geomatics, remote sensing and image processing
  • Mobile and location based services
  • Dynamic modeling and simulation
  • INSPIRE: Geoinfrastructure
  • VGI and OpenSource geoinformation software
  • Real time forum: Best practice

For more information and registration please see www.agit.at

New publication: From Information to Participation. Interactive Landscape Visualization as a Tool for Collaborative Planning

Cover
Cover

If landscape visualizations are applied as tools for participation, they should provide a high level of interactivity to facilitate planning process and outcomes. This book presents evidence for this hypothesis through demonstrative case studies in the Entlebuch UNESCO Biosphere Reserve in Switzerland. In collaborative workshops, interactive real-time visualizations were used to respond directly to the dialogue, and long-term climate change impacts were illustrated through collapsing time animations.

This thesis is now available as a book and can be order at http://www.vdf.ethz.ch/vdf.asp?showArtDetail=3222

Social Mobilisation for Climate Solutions Research Workshop

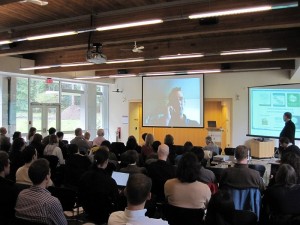
Last week, the Social Mobilisation for Climate Solutions Research Workshop took place at the Peter Wall Institute at the University of British Columbia. The workshop started with the “Changing Perceptions of Climate Change through Community Action” public sessions by Rob Hopkins (Transition Network), Elke Weber (Columbia University) and Stephen Sheppard (University of British Columbia). The event can be watched as webcast recording at http://www.socialmobilisation.pwias.ubc.ca.

After a number of workshop sessions, the series closed with a demo session, sponsored by GRAND. The DIGITAL MEDIA DEMO SESSION featured tools from leading local developers and academics who are advancing digital tools to communicate and mobilize meaningful action on issues of environmental sustainability and climate change.

Demo stations and presenters included:

New publication: Visualizing Landscape Architecture

Visualizing Landscape Architecture

I would like to draw your attention to a new book by Prof. Dr. Elke Mertens about visualization in landscape architecture. The book is very well presented by Birkhäuser, a publisher famous for his excellent books about architecture, and gives a great overview of various visualization techniques in landscape architecture. Please note that the book is available in English and German. The following is a quote from the Amazon description of the English version:

“We don’t sell gardens; we sell images of gardens.” This observation on the part of a landscape architect makes it clear just how important it is that a design be effectively communicated to the community, clients, and the public. Drawings, models, simulations, and films communicate the designers’ proposed ideas and solutions, but they also convey their attitude toward the use of nature and the environment. With myriad possibilities – including computer programs as well as hand drawings and models, which continue to be widely used – and strong competition in the field, there is now a huge variety of visual representations, with agreed-upon rules but also a great deal of freedom. In three large sections, this books sifts through the currently commonplace and available techniques and evaluates them in terms of their informative value and persuasive power, always illustrating its points with analysis of examples from international firms. An introductory look at the development thus far is followed by a systematic presentation of modes of representation in two, three, and four dimensions – in the plane, in space, and in the temporal process. The second section deals with the sequence within the workflow: from the initial sketch through concept and implementation planning all the way to the finished product. The third section deals with the strategic use of visualizations in the context of competitions, future schemes, and large-scale landscape planning. The focus in this section is not on the familiar use of the relevant techniques, but rather on the methods and forms of visual representation in contemporary landscape architecture.”

Visualizing Landscape Architecture at Springer

Visualizing Landscape Architecture at Amazon

Tools for the understanding of spatio-temporal climate scenarios in local planning: Kimberley (BC) case study

Major adaptation and mitigation

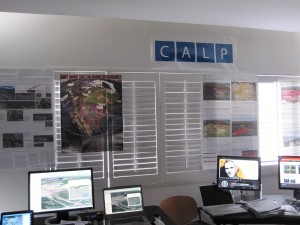
Funded by the Swiss National Science Foundation SNSF, and in collaboration with the Collaborative for Advanced Landscape Planning (CALP), particularly Ellen Pond, the City of Kimberley, and the Columbia Basin Trust (CBT), I analysed the benefits and limitations of interactive virtual globes for stakeholder engagement in climate related scenario planning over the last 12 months. The results have now been published as SNSF report and can be downloaded here.

Bing Maps incorporates Photosynth models and is aiming at semantics in the long-term

Microsoft Photosynth is a photogrammetric software that creates 3d buildings from multiple photos, e.g. shot by random tourists. Our colleagues from the urbandigital blog are very much in favour of Photosynth and see great potential in it for urban visualization or as a kind of 3d scanner. Now, Microsoft has taken the logic next step and integrated Photosynth with Bing 3D. It may be criticized that the Microsoft approach requires Silverlight which is still not standard. However, Bing users can now create buildings automatically from photos whereas Google Earth users are modeling their content in Sketchup. It will be very interesting to test both approaches in comparison and to see which one will finally find more users.

Another interesting approach by Microsoft is mentioned by Chris Dannen in the Fast Company blog: In the long-term, Microsoft wants to extract semantic information automatically from the user-generated photos. In this point, Microsoft meets latest research in photogrammetry, e.g. in the “Nachwuchsgruppe der Volkswagen Stiftung” in cartography at the University of Hanover, where the automatic extraction of facades from photos is researched.

With regard to landscapes, vegetation is still not an issue – neither for Google nor for Microsoft. How about the automatic extraction of vegetation information from photos? There is a lot research about the recognition of vegetation in orthophotos – how about linking this to the automatic population of virtual landscapes with realistic plants?

ETH-Klimablog

Now that the Copenhagen Summit comes close, ETH Zurich has started a Climate Blog with contributions by 20 ETH professors and numerous student and guest authors. Unfortunately, the blog is in German but due to the high impact of climate change for our future landscapes and with regard to our work on climate change visualization at CALP, I inlcuded the ETH climate blog in the LVIZ blogroll. Please follow the blogroll on the right or go directly to http://blogs.ethz.ch/klimablog/.

MapViewSVG renamed Mappetizer

The very useful GIS tool MapViewSVG has been renamed “Mappetizer“. According to the developer, the latest version Mappetizes 8.1 additionally has integrated support for OpenStreetMap (OSM) data (example). Yet, we didn´t have the opportunity to test this new functionality but considering our interest in open source solutions and especially geodata under creative common licenses such as OSM, we are curious about testing Mappetizer 8.1 as soon as possible.

Final Call – International Conference on Theory, Data Handling and Modelling in GeoSpatial Information Science, May 26th to 28th 2010 in Hong Kong.

The following call for papers was first published at Digital Urban

We have a final call for papers in geographic/urban visualisation – the deadline for abstracts has passed but as we are running a workshop send them to us via the contact page and we will sort out the initial submission process.

The Joint International Conference on Theory, Data Handling and Modelling in GeoSpatial Information Science will be held on May 26th to 28th 2010 in Hong Kong.

This conference will be a notable event in the international community of Geo-spatial information Science (GISc) in 2010, organized by: Commission II of the International Society of Photogrammetry and Remote Sensing (ISPRS) and Commission of Geographic Information Science and Commission of Modelling Geographical Systems of the International Geographical Union (IGU). The conference will join together the Symposium of Technical Commission II of ISPRS, the Symposium on Spatial Data Handling and the Conference on Modelling Geographical Systems from IGU.

ISPRS is a society regrouping scientific societies from more than 100 countries working in domains related to photogrammetry, remote sensing and geographical information science. 2010 will be a special year for the society as it will be celebrating its centenary anniversary. The ISPRS Technical Commission II Symposium is organised every four years alternately with the ISPRS Congress and is among the major events in ISPRS calendar regrouping leading scholars from the GISc and related communities. Last editions of the symposium were held in Ottawa, Canada (2002) and Vienna, Austria (2006) jointly with SDH.

You can find the submission guidelines and template from here.

Also take a look at the new Geovisualisation and Virtual Reality site (its hosted in CASA) where you can sign up to become a member.