Addendum to the previous post about the CIRS Opening Conference

The David Suzuki opening lecture is now available online and you can watch it on YouTube: http://youtu.be/vbjExkoDMH4. CIRS is posting conference material here:
http://cirs.conference.sustain.ubc.ca/presentations-etc/.

This will be updated with a few more presentations on Friday December 2nd and CIRS will continue to add content.

CIRS Opening Conference 2011

 
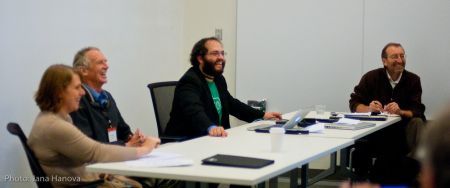
November 3rd-5th, the new Centre for Interactive Research on Sustainability (CIRS) at UBC had its Opening Conference under the title "Celebrating CIRS – Accelerating Sustainability". As part of this conference, the "Community Engagement and Social Media" theme hosted two sessions which are of particular interest for this blog: Social and visual media: Tools & techniques for engagement and Bridging processes and perspectives into the future. Key lessons from these two sessions are summarized below:
 
The first presentation on "Social and Visual Media as Tools & Techniques for Social Engagement" was given by Ian Bishop (University of Melbourne). Focus of his presentation was a project on Tasmanian forest management which involved a GIS-based scenario builder and ScenarioChooser (see my previous blog entry). The project was complemented through an evaluation showing that the overall process was effective, although some people made little use of the visualizations. In terms of interactivity, the project had chosen panoramas as a tradeoff between effort and impact and the evaluation showed that these panoramas were indeed effective.

Next, Katy Appleton from the University of East Anglia gave an overview of evaluation research with regard to climate change visualizations ("Evaluating the Use of Visualization for Communication about Climate Change"). She asked what works best and how far visualizations can improve understanding, engagement, support for policies, and individual change of behavior. Considering the technical development and the lack of evaluation research described by Lange (2011) in "99 volumes later. We can visualize. Now what?" it became clear that we need an updated research agenda on the evaluation of landscape visualization.

Finally, Joe Salomon from 350.org provided a visually strong link to activism and shared his stories how 350.org got millions of people in every country around the world except North Korea involved in climate action. Social media such as twitter did play an important role and perhaps educational games will do as well but in the end, "real life is the most exiting game".

The following panel discussion addressed questions how to integrate visualizations and social media in the best way, how to engage people, and how to evaluate such projects.


The afternoon panel was started by Arnim Wiek (Arizona State University) who addressed the question of "Effective Stakeholder Engagement in Transformative Sustainability Efforts" with a case study from Phoenix with the emphasis on transformation. There are some good scenario studies but how do we get from scenarios to actual implementation, i.e. truly transformative outcomes? Arnim Wiek finished with six recommendations how to support transformative action, i.e. 1) go beyond scenarios, 2) go beyond the usual suspects, 3) train and coach facilitators, 4) move from extraction to negotiation, 5) embrace community diversity, 6) mobilize the Decision Theatre at CIRS. For the later, he also recommended increased collaboration and a shared research agenda.

Second speaker at the afternoon panel was Michael Flaxman (MIT), who presented a project on "Climate Change Adaptation in Southern Florida's Everglades Landscape: A Spatial Resilience Planning Approach". In this project, a scenario-based participatory stakeholder process with about 200 professional community members was implemented. The goal was to simulate alternative futures considering climate change; effects on wildlife habitats and species; and provide a sensitivity analysis of policies. The three drivers for the scenario development were 1) rapid population growth, 2) planning assumptions regarding land use and water and 3) climate change. The planning process was very well structured and accompanied by an evaluation, allowing to draw most valuable insights. Visualizations, especially in the form of maps, were another integral part of the process and Michael Flaxman particularly suggested interactive web maps as a very promising tool for regional planning.

The third speaker was Jennifer Penney (formerly Clean Air Partnership) and she gave a hands-on view of "Engaging Local Government in Climate Change Adaptation".
 
Some suggestions from the final discussion were that we have to go beyond anecdotal evidence in our evaluation research; that we should build a shared online database of decision-support tools; and to have more collaboration in general. In planning, maps as "boundary objects" are extremely useful, especially if they are communicated together with a narrative and pictures. However, it is still open how far such processes will trigger transformative change but here, planners may learn from the Transition Town movement and researchers can contribute through more cooperative longitudinal evaluation.

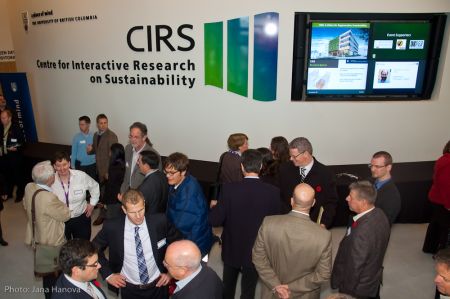
Centre for Interactive Research on Sustainability – Opening Conference

Please excuse the short notice but perhaps some of you are in the area and could still make it. Key notes are delivered by Steve Rayner from Oxford University and David Suzuki. In terms of visualization, the conference will host a panel on “Social and visual media: Tools & techniques for engagement” with Katy Appleton (University of East Anglia) and Ian Bishop (University of Melbourne); and another panel titled “Bridging processes and perspectives into the future” with Arnim Wiek (Arizona State University), Michael Flaxman (MIT), and Jennifer Penney (Clean Air Partnership).

What: Celebrating CIRS | Accelerating Sustainability
When: November 3 – 5, 2011
Where: University of British Columbia, Vancouver BC

For more information and to register, visit
http://cirs.conference.sustain.ubc.ca/.

Open Data for Berlin

The idea of Open Data is not new and scientists have promoted free exchange of data for a long time. However, the term Open Data refers to the recent trend in informatics and geospatial sciences to provide geographic data free to use. Pioneers were particularly in the UK, US and Canada, where it has traditionally been claim that government geodata should be free. Vancouver for example launched a rather decent Open Data website. This initiative created many possibilities for various new location based apps such as the very successful Vantrash that gives inhabitants of Vancouver the current schedule for recycling and garbage pick-up.

Now, Berlin as first major German city has set up a website with government Open Data under http://daten.berlin.de/datensaetze and it is to hope that this will trigger similarly successful geospatial applications.

Street Slide – Street View a la Microsoft

Digital Urban highlights a Microsoft SIGGRAPH paper and patent that present an advanced Street View like technology, which combines the immersive nature of 360° Panoramas with the overview provided by multiperspective strip panoramas. The video also demonstrates the almost seamless transition between the panoramas.

IMAGINA 2011 CALL FOR PROJECTS

Conferences: Urbanism & Landscape
Wednesday 2 and Thursday 3 February 2011

Submit a presentation about your experience in 3D for the following themes:

your 3D experience to plan, manage and promote your city or your territory.
your adoption of « Geo-referenced » 3D model in the context of your project studies.
your experience of 3D applied to the preservation of landscape and natural areas.

Preview ESRI ArcGIS 10: 3D GIS at ArcGIS 10

This video shows some lang to display, analyze, and maintain 3D data in ArcGIS 10. Visit:

http://www.youtube.com/watch?v=1ake22nfomg&feature=related

Social Mobilisation for Climate Solutions Research Workshop

Last week, the Social Mobilisation for Climate Solutions Research Workshop took place at the Peter Wall Institute at the University of British Columbia. The workshop started with the “Changing Perceptions of Climate Change through Community Action” public sessions by Rob Hopkins (Transition Network), Elke Weber (Columbia University) and Stephen Sheppard (University of British Columbia). The event can be watched as webcast recording at http://www.socialmobilisation.pwias.ubc.ca.

After a number of workshop sessions, the series closed with a demo session, sponsored by GRAND. The DIGITAL MEDIA DEMO SESSION featured tools from leading local developers and academics who are advancing digital tools to communicate and mobilize meaningful action on issues of environmental sustainability and climate change.

Demo stations and presenters included:

Natural Earth public domain map dataset

Natural Earth is a public domain map dataset available at 1:10m, 1:50m, and 1:110m scales. “Featuring tightly integrated vector and raster data, with Natural Earth you can make a variety of visually pleasing, well-crafted maps with cartography or GIS software.”

Natural Earth Vector comes in ESRI shapefile format, Natural Earth Raster comes in TIFF format with a TFW world file, all Natural Earth data use the Geographic projection, WGS84 datum.

Unfortunately, only zip-File Download and no OGC Web Feature or Web Raster service is provided.

ETH-Klimablog

Now that the Copenhagen Summit comes close, ETH Zurich has started a Climate Blog with contributions by 20 ETH professors and numerous student and guest authors. Unfortunately, the blog is in German but due to the high impact of climate change for our future landscapes and with regard to our work on climate change visualization at CALP, I inlcuded the ETH climate blog in the LVIZ blogroll. Please follow the blogroll on the right or go directly to http://blogs.ethz.ch/klimablog/.