The PhD is closley linked to the Improving Wellbeing through Urban Nature project
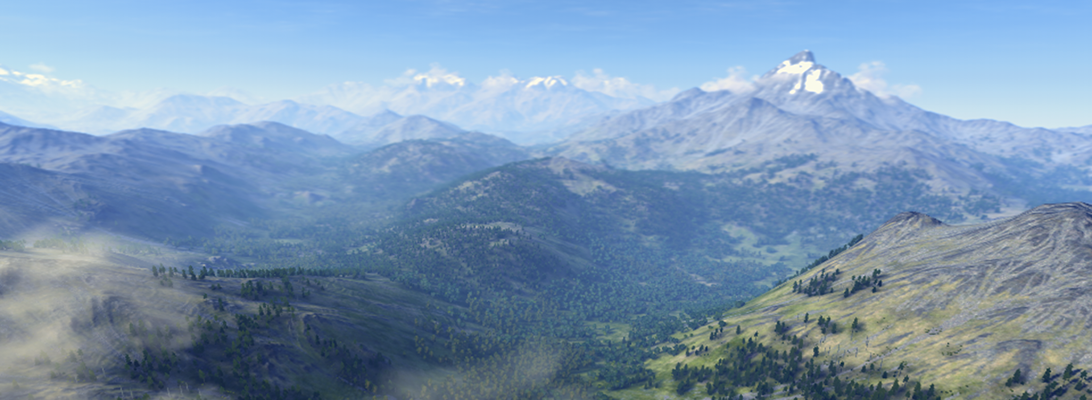
Funding has become available for a PhD, which will investigate whether a smartphone App can encourage people to spend time outdoors.
The PhD, Can a smartphone App promote therapeutic interactions with the natural environment? is closely linked to the three-year Improving Wellbeing through Urban Nature research project, which is being led by the University of Sheffield’s Department of Landscape.
The successful applicant will support the development of a smartphone App, evaluate the efficacy of the App as a data collection tool and work closely with project partners to explore the potential for the App as a green prescription.
Based on data collection via the smartphone App, the project aims to answer the following research questions:
• Which types of urban natural environments are most effective in delivering health and wellbeing benefits?
• What level of exposure to natural environments (duration) brings about benefits in health and wellbeing?
• How does quality of experience in nature impact on he benefits?
• How do individual differences and demographics mediate health and wellbeing benefits?
• What are the differing impacts of natural environment exposure on mental health service users and non-users?
Applicants should have minimum of a 2:1 first degree in a relevant discipline/subject area or a Masters in a relevant discipline/subject area. Applications are open to UK, EU and international students but University fees will only be waived up to the UK/EU maximum. A stipend starting at £14,296 and rising in line with RCUK rates will be awarded annually.
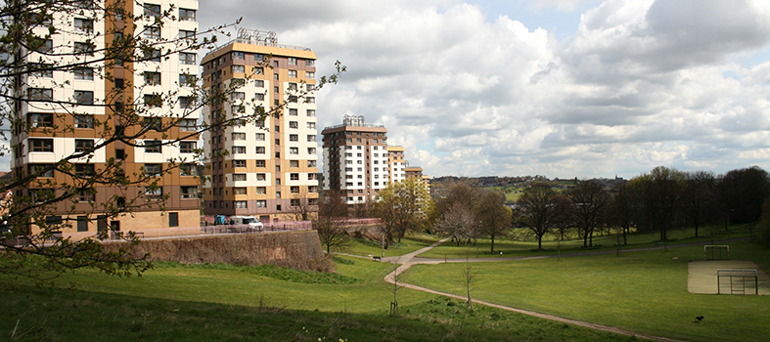
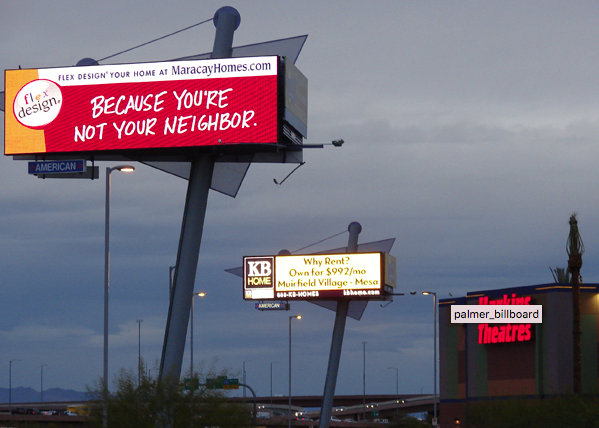
It has been 50 years since the White House Conference on Natural Beauty took a hard look at the state of scenic America. What has happened to this country’s scenic assets since then?
In an interview with ASLA, Dr. James Palmer, is looking back on the assessment of scenic quality in the US and summarizing today’s state of research. At the end of the research, he is finally giving an outlook where future research should go.
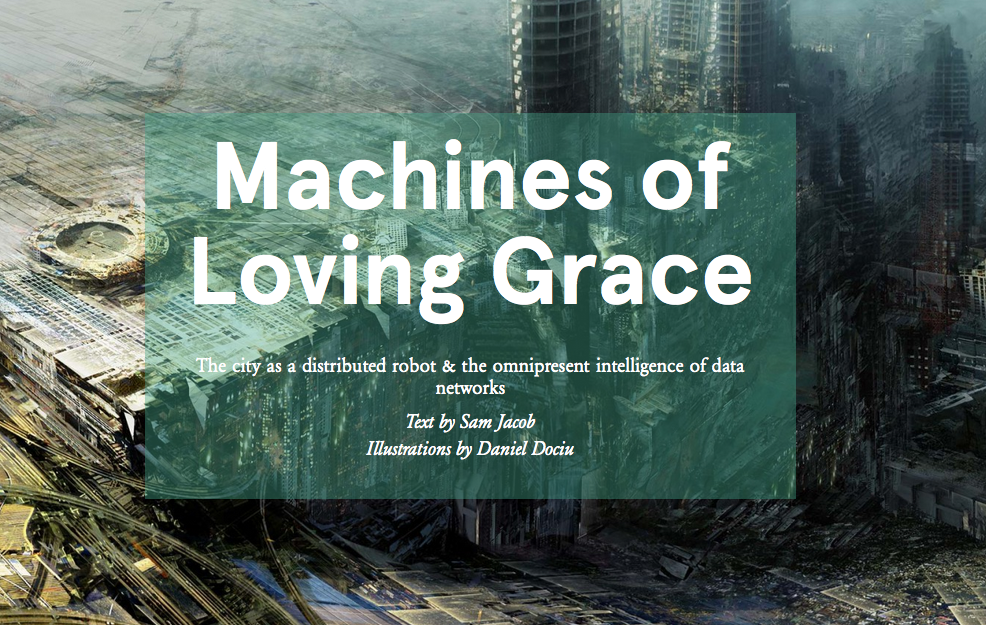
Machines of Loving Grace – The city as a distributed robot
Issue no. 36 of uncube, “Uncanny Valley”, is taking a look into the latest developments in robotics and intelligent systems in architecture. If this is for architecture, what could be the potential in landscape architecture?! Well worth a look:
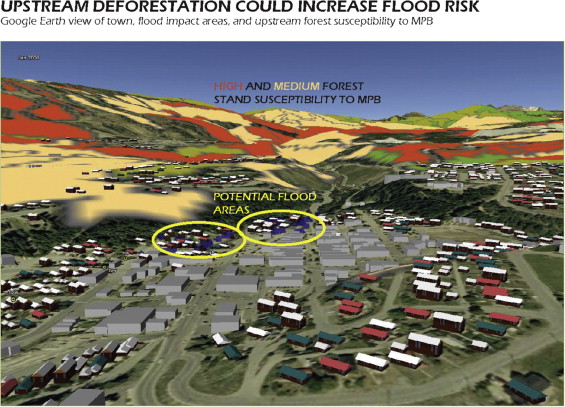
I am excited to present the following research paper in Landscape and Urban Planning because it summarizes the work my colleagues and I put into my favorite research project, the Kimberley Climate Adaptation Project KCAP. It was very rewarding working closely with the local community, visualizing different development scenarios and their interactions with climate change impacts. Great to see that about 70 recommendations from the original visioning process were adopted in various policy documents and a dozen actually implemented. The paper looks in more detail at one of the implemented mitigation measures, a flood retention area along the river that leads through Kimberley.
Reference:
Olaf Schroth, Ellen Pond, Stephen R.J. Sheppard, Evaluating presentation formats of local climate change in community planning with regard to process and outcomes, Landscape and Urban Planning, Available online 1 May 2015, ISSN 0169-2046, http://dx.doi.org/10.1016/j.landurbplan.2015.03.011.
Abstract:
This study synthesizes two evaluations of a local climate change planning process in a rural town in British Columbia (Canada), which was supported through landscape visualizations. First, the impact of the visualizations, based on scientific environmental modeling and presented in three different presentation formats, verbal/visual presentation, posters and a virtual globe, was evaluated with regard to immediate impacts during the process. Second, the long-term impacts on decision-making and actual outcomes were evaluated in a retrospective evaluation 22 months after the end of the initial planning process. Two results are highlighted: according to the quantitative pre-/post-questionnaires, the visualizations contributed to increased awareness and understanding. Most importantly, the retrospective evaluation indicated that the process informed policy, operational and built changes in Kimberley, in which the landscape visualizations played a role. The post interviews with key decision-makers showed that they remembered most of the visualizations and some decision-makers were further using them, particularly the posters. The virtual globe seemed to be not a “sustainable” display format suitable for formal decision-making processes such as council meetings though. That may change with the further mainstreaming of visualization technologies or mobile devices. Until then, we recommend using display formats that can be re-used following a specific planning event such as an Open House, to ensure on-going support for effective decision-making over the longer-term.
Research Highlights:
• Visualizations in a climate change planning process were assessed as very helpful by local stakeholders and residents.
• Visualizations presented in a virtual globe facilitated understanding and increased awareness during an open house.
• 22 months later most decision-makers still remembered or used the visualizations.
• Visualizations embedded into process informed policy, operational and built changes.
• Although the virtual globe presentation format was effective during the process it was less so in the long term.
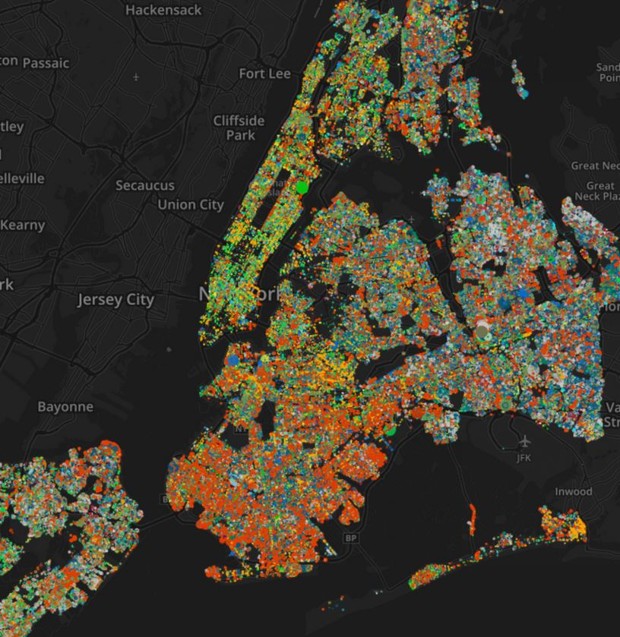
Jill Hubley, a Brooklyn web developer whose last project involved mapping local chemical spills, made the chlorophyllous cartography with data from the 2005-2006 Street Tree Census. Zoomed out, it looks kind of like oodles of stained cells under a microscope:
http://www.energyexplorer.ca/home-energy/
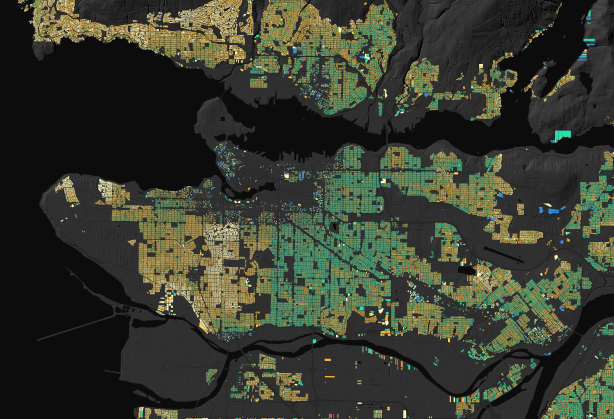
Energyexplorer is a website that comes out of research at UBC Vancouver aimed at building public energy literacy. By interacting with highly visual and contextually relevant information, Metro Vancouver citizens are encouraged to uncover how energy is an intricate part of their community. From a technical point of view, the resolution of the data is extraordinary which I think became possible through using LiDAR data. Furthermore, I’m very impressed with the fantastic representation on top of a topographic basemap.
Rory Toke, the main developer behind the Energy Explorer, is also running a blog intended for those people interested in tracking the progress and participating in the development of the Community Energy Explorer project. Find his blog at http://www.energyexplorer.ca/blog/ or now in our blogroll on the right.
Graceland: This January 8th, Elvis Presley, who inspired the name of this blog, would have his 80th birthday. His fans will always remember him and his birthday was celebrated around the globe. Happy Birthday Elvis! 😉
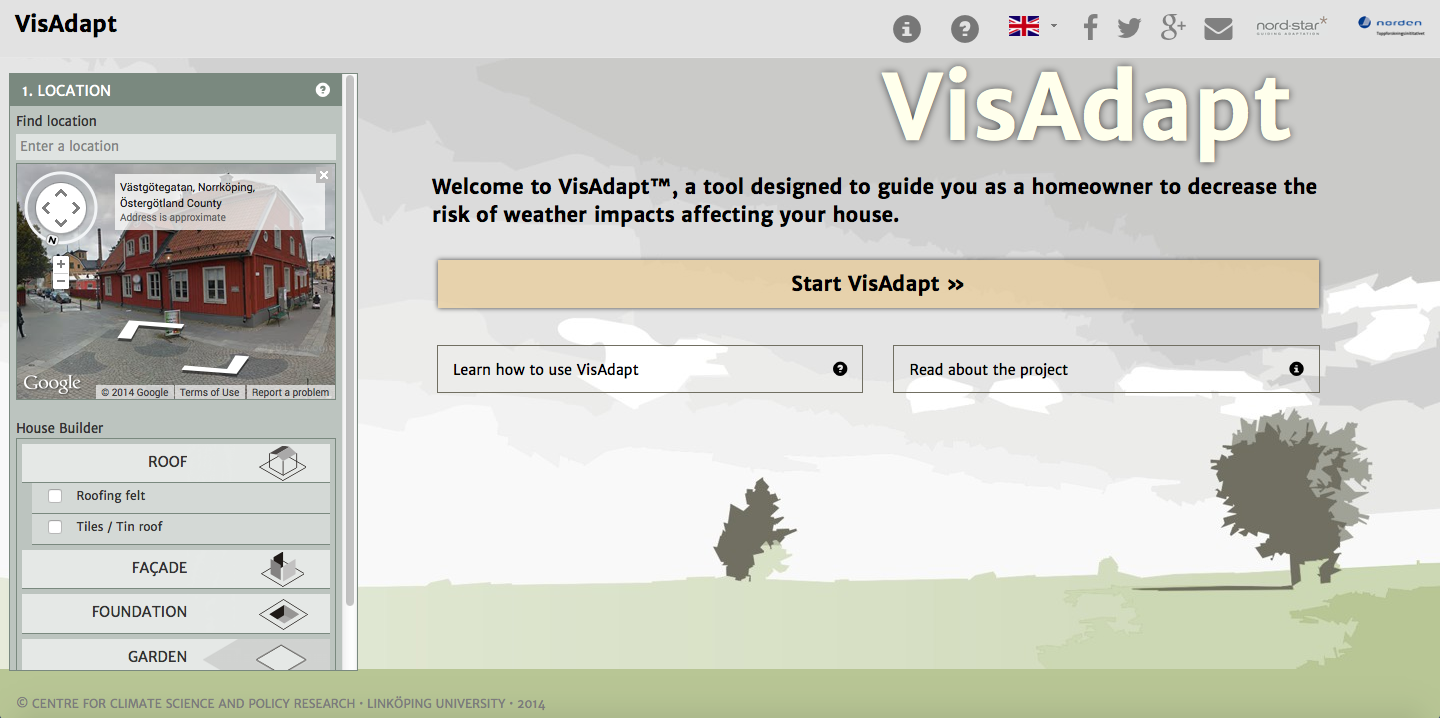
Last week, VisAdapt, a web-tool to assist Nordic (Sweden, Denmark, Norway) home owners to adapt to climate change, has been launched. It is developed within the Nordic Centre of Excellence Nordic Strategic Adaptation Research (Nord-star).You just type in the address of your house and choose the characteristics/building materials of your house and the tool will give you an estimate of regional climate change predictions for your region and how your house will perform under those conditions.
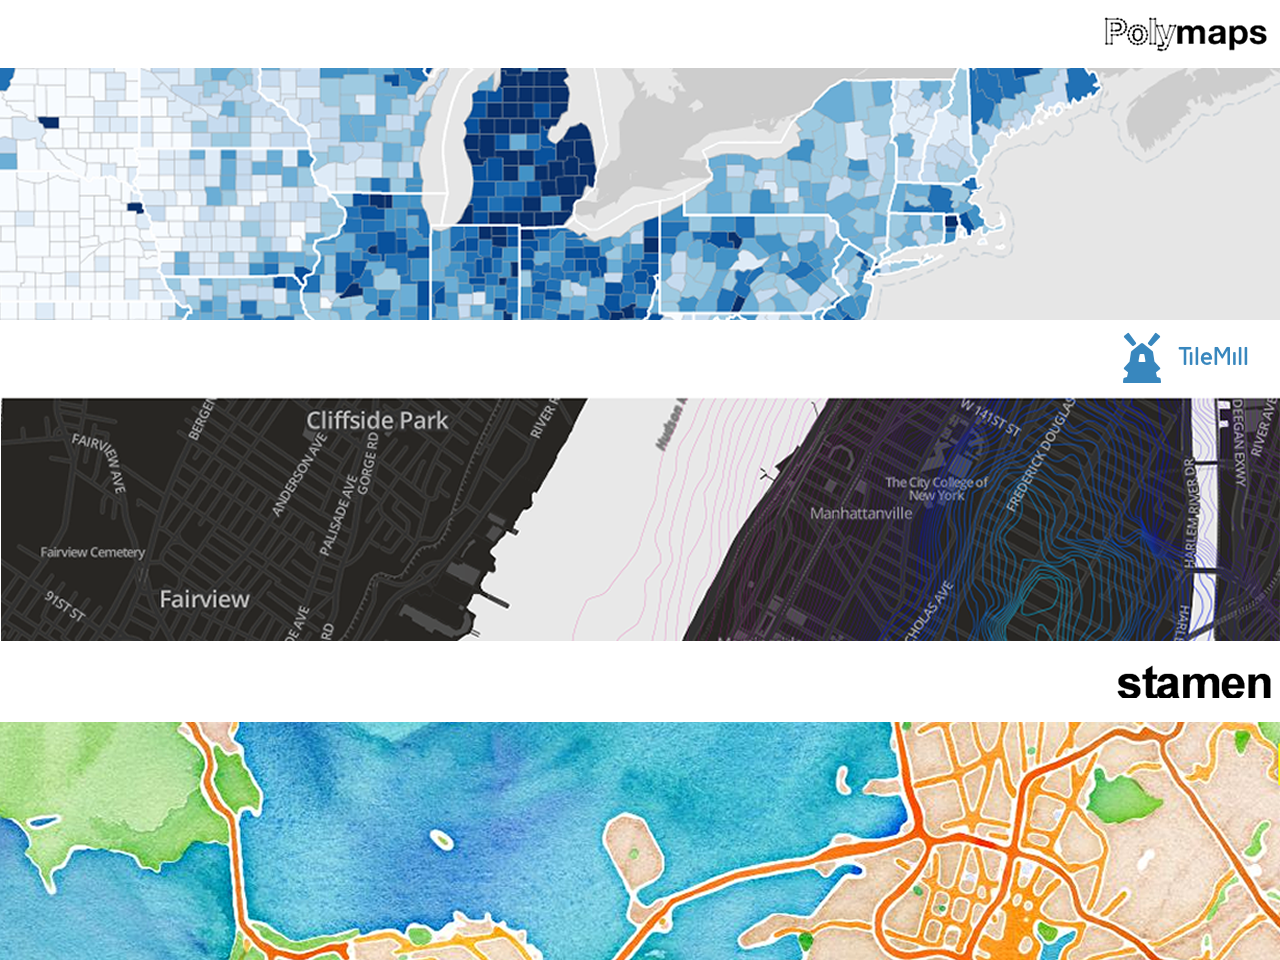
Please have a look at the following blog post, in which Rory Toke from the Collaborative for Advanced Landscape Planning (CALP) at the University of British Columbia (UBC) is reviewing various mapping software packages. Most helpful! http://www.energyexplorer.ca/blog/mapping-software-evaluation/
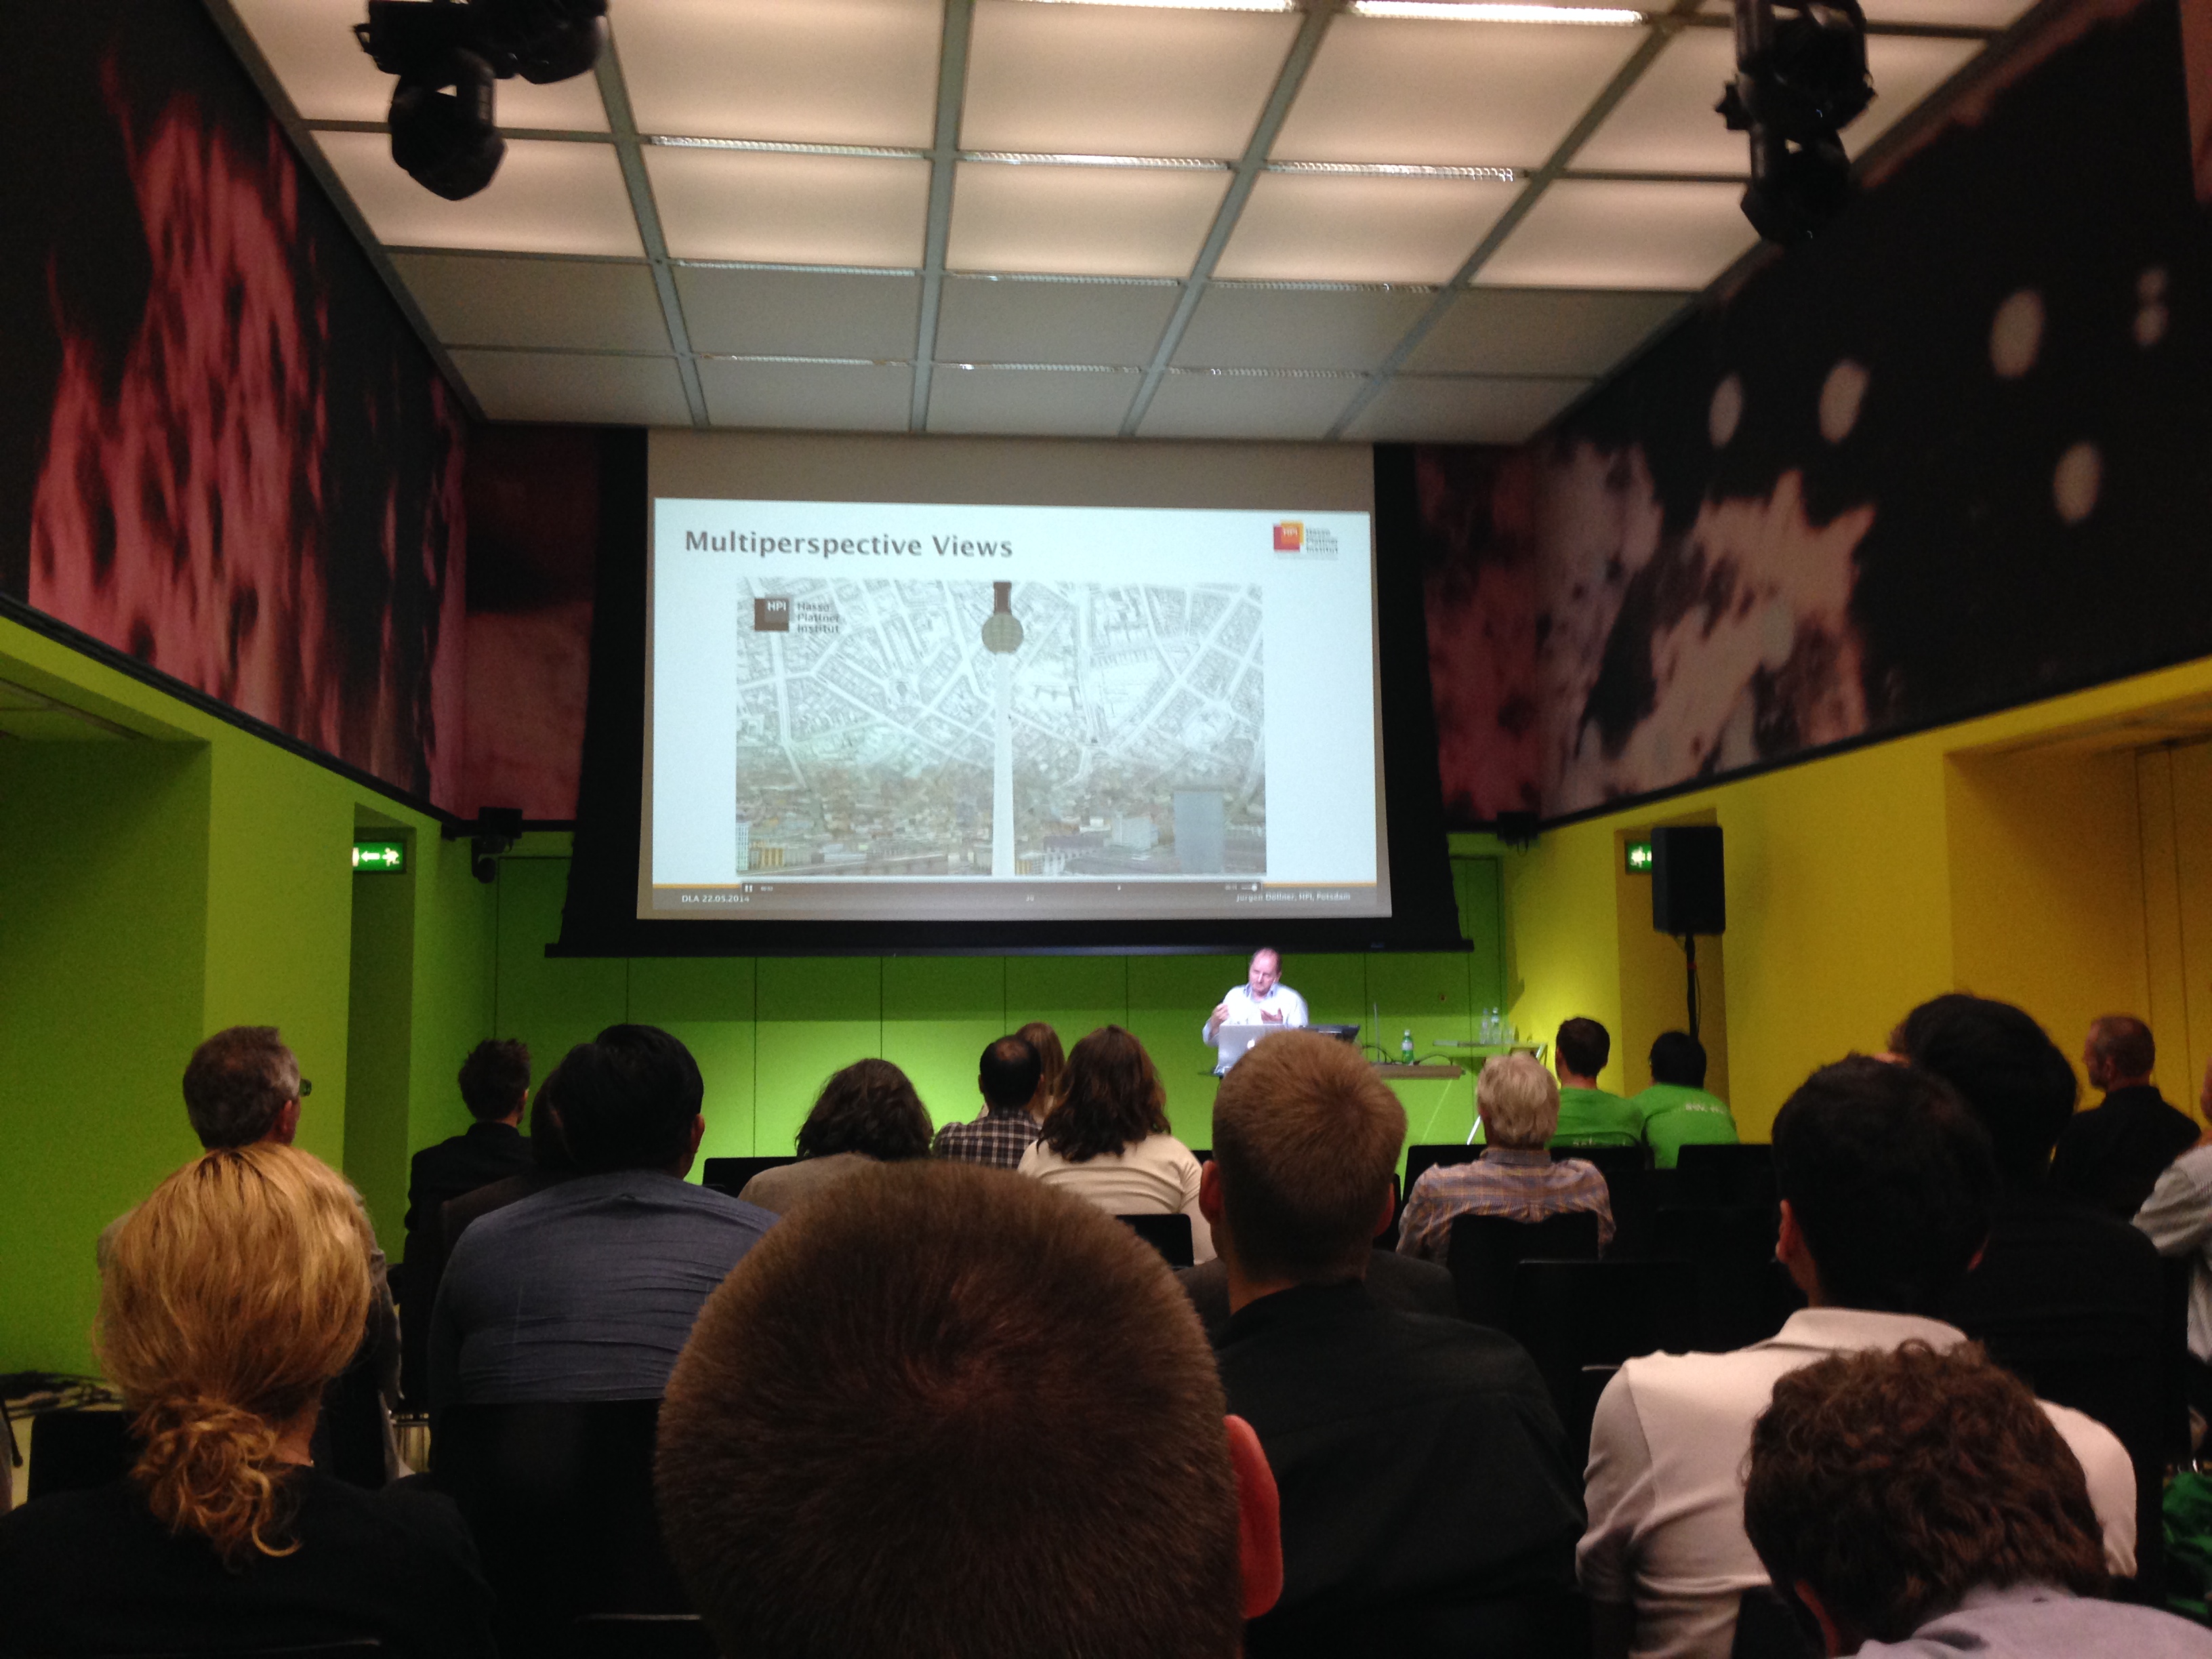
Juergen Doellner (2014): Service-Oriented Geovisualization for Geodesign
This year, the Digital Landscape Architecture (DLA) conference celebrated its anniversary. For its anniversary, DLA had picked a special place – the HIT Lab at ETH in Zurich. Among the many very good presentations, workshops and keynotes, I would like to point you to a couple of keynotes addressing new technological advances in the field of landscape visualization: